Setting labels and division of X axis in XY charts of Excel as time
as add-in for Microsoft Excel
Because since version of Excel 2007 inclusive, when creating XY charts that are drawn as a function of time (time is on horizontal X axis) I miss ability to simply specify axis parameters as time, to speed up work I once made an add-in for Excel that does this.
Description of how formatting of axis as time in Excel worked earlier (before Excel 2007) and works now: when time data is applied to axis in an Excel XY chart, Excel treats it as a number according to its own representation of time (in basic setting it counts as integers days from 1.1.1900 and hours are in decimal form as follows: 24 hours = 1 day, therefore number one, and then for example 12 hours = 0.5 and for example time value 12:00:00 hours on 1.1.2023 will be expressed as number 44927.50 in Excel representation) and does division of axis for decimal numerical expression of time in Excel, but which does not correspond to dividing time by 24/60/60, so this description of axis is quite cluttered. In earlier versions of Excel (before Excel 2007) it was enough in such a case to enter time data formatted as time (for example in form 12:00:00 1.1.2023) into window for setting axis and Excel converted it into its representation of time and displayed it in input window. It wasn't very intuitive to see a number instead of time in axis division input window, but at least it was something, and especially Excel set axis according to entered value and its labels in chart were formatted as time in this case, so this seemed to be quite satisfactory, display of number at setting could be overcome. But from version 2007 onwards, according to my experience, Excel no longer accepts such settings, for example Excel 2016 probably understands it as an error, but it does not say anything and is stupidly silent, it does not accept such input and returns original numeric value that was there before this input, horror as I have already written here with other Excel programs, Excel is getting "better and better".
So, I made add-in described here (.xlam file), which is always available for use after installing it in Excel (it is called from ribbon bar when is selected and active chart, which has time data on horizontal X axis and was previously made in Excel) and after calling it displays a window with data for X axis and after changing data chart changes immediately, so you can see "what it does". Finally, changes made can either be applied or cancelled and return chart to state before add-in was called.
Add-ins for Excel have advantage that their functionality (according to my tests) is not affected by setting option to enable or disable execution of macros in Excel Security Center, but disadvantage is a slightly more complicated installation into Excel, which will be described later.
Because, as already mentioned, add-on is launched from so-called ribbon bar, it is designed for Excel from version 2007 and newer ("latest" version it was tested on is version 2019, I do not have a newer version or Excel 365, but it should work in newer versions), in versions before Excel 2007 it will probably not work, because they do not have ribbon bar yet, and also add-on would have to be saved as an .xla file, and it's not. So, it ONLY works in versions of from Excel 2007 onwards inclusive, it does not work in older Excel and elsewhere, so there I can't vouch for functionality.
Installing add-in into Excel:
I will describe installation for versions of Excel newer than Excel 2007, because it is slightly different in 2007 version and I don't suppose anyone is still using Excel 2007. (For example, Excel 2007 installs add-ins in a directory with a name that is localized to language used, such as in Czech is directory name "Doplňky", instead of "Add-Ins" used in later versions regardless of localization, as described later here.)It is best to copy add-in downloaded from link below ("Time parameters of X axis.xlam" file) to Excel add-in directory, although Excel allows you to have add-ins also in other directories, as it allows you to browse directories when adding them. I will describe here installation into default directory for add-ins, but if someone does not have access rights to it (that is, has total lawless on computer), they can install it from anywhere, but if someone deletes add-on file later, it wouldn't run anymore of course. Default directory for add-ins has firstly "advantage" that it's quite hidden and secondly, I don't even know how it is on different versions of Windows with access rights to it, whether every user can get to it, whether it can be deleted etc. So, default directory for add-ins (for newer versions of Excel than 2007) is called "AddIns" (without quotes and probably in all language versions of Excel) and is (mostly) in following path:
C:\Users\“present user“\AppData\Roaming\Microsoft\AddIns
Where: C: is system disk (operating system is installed on it)
"present user" is name of account on computer for which we want to install add-in, of course without quotes
And downloaded add-in (file "Time parameters of X axis.xlam") is copied to this directory.
Then Excel is started (preferably empty, but it is not a requirement) and in it one clicks on "File" and then on "Options" and in window that opens after clicking on "Options" one clicks on "Add-ins":
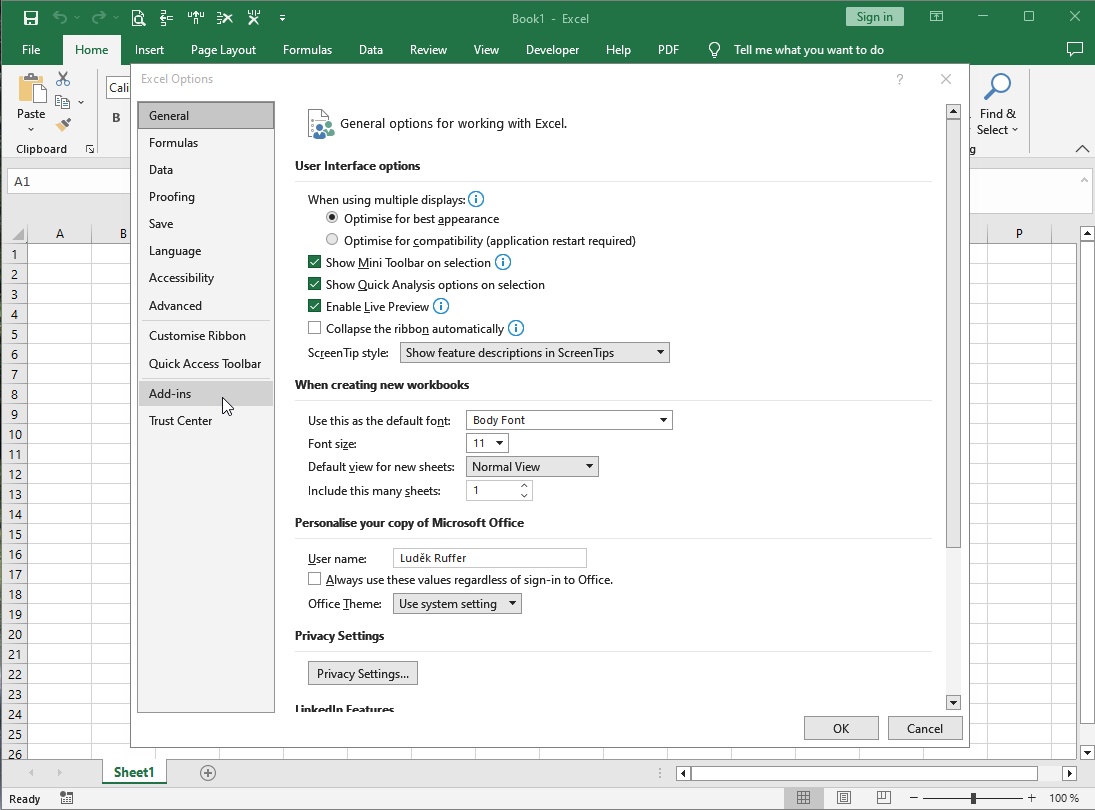
and after clicking on "Add-ins" there should be visible this:
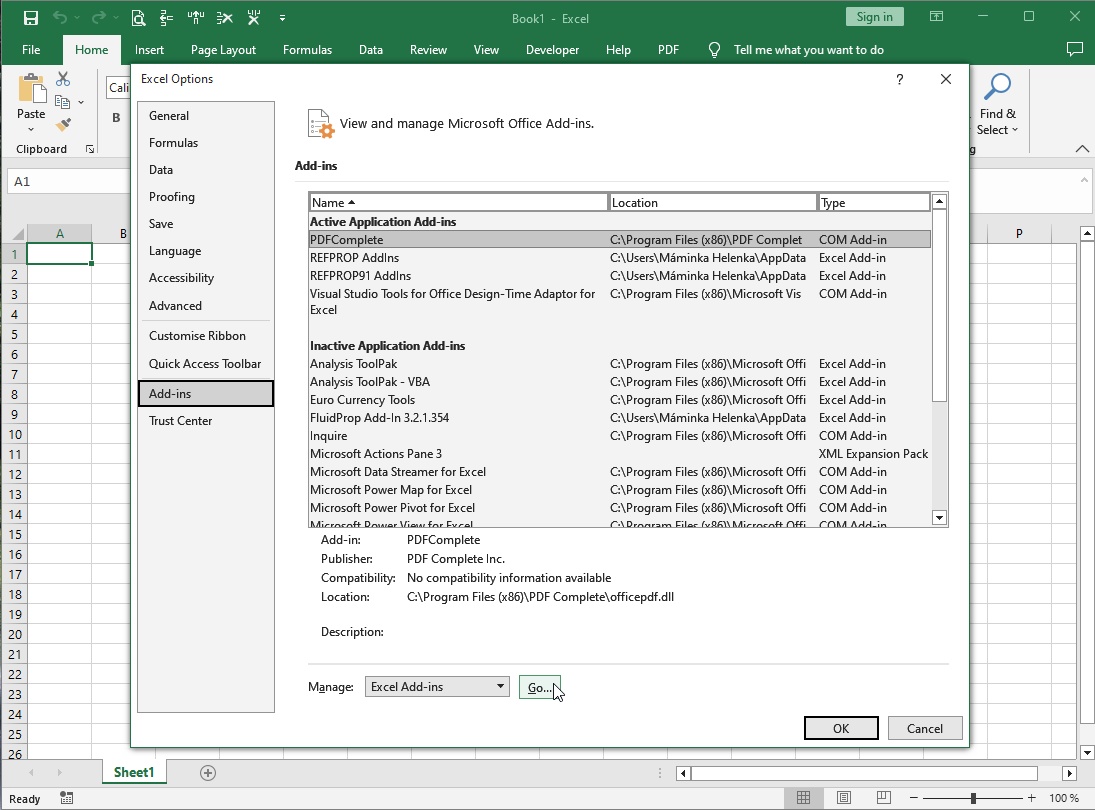
Here click on "Go...", as indicated in picture, and then window for selecting add-ins will appear, which looks something like this:
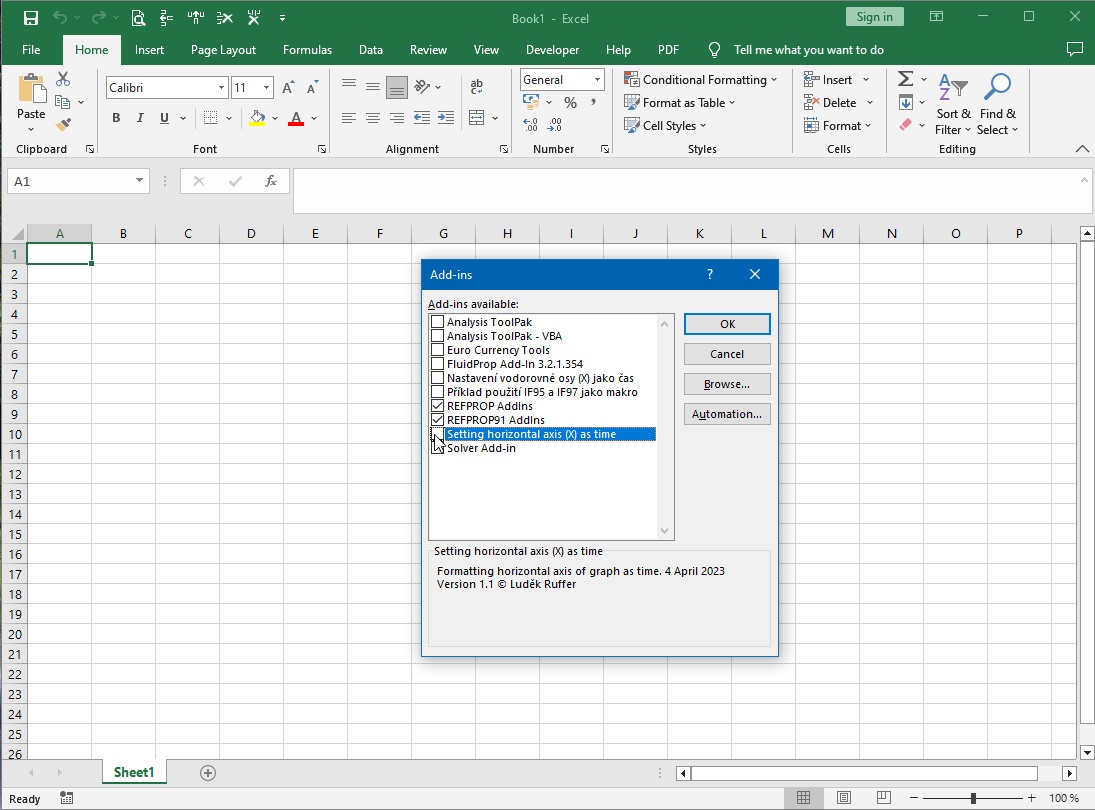
So, if "Time parameters of X axis.xlam" add-in file was previously copied to "...AddIns" directory, "Setting horizontal axis (X) as time" line will be visible in "Add-ins" pane, as shown in picture. This is add-in, which to be embedded, as you can see from text that is displayed below the pane, so click on empty square in front of text (then it will be checked), as indicated in picture. This will make add-in available for use and adds "Programs NUF" tab to ribbon bar.
If an add-in is not visible in “Add-ins available:” pane, it most likely has not been copied (not necessary) or copied could not be (lawless in access rights) to "...AddIns" directory and must first be found by clicking on "Browse..." button next to “Add-ins available:” pane and selected from another directory where it was saved when downloaded, then it should be visible, so it can be selected by clicking on empty square.
Control of add-in:
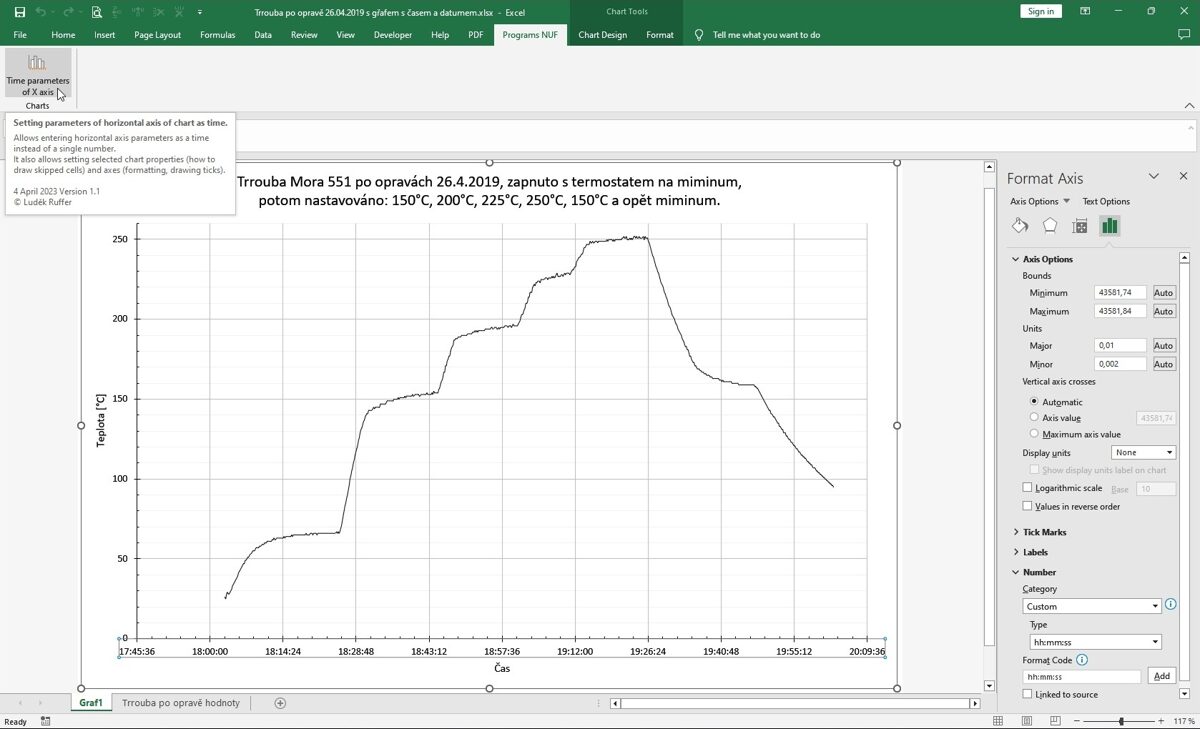
For add-in to work, it must have selected (active) some chart previously created in excel with a horizontal axis that can be formatted as time, and it does not matter if chart is on a separate sheet or is just part of some other sheet. However, chart must be selected (by clicking mouse on chart and chart should be framed as in picture) so that add-in knows which chart to process, otherwise add-in button in ribbon bar will only display an error message.
In chart above you can see X axis as time, as it was created by Excel, where division into minimum, maximum, major and minor ticks is decimal, which is not apparent at first glance from their labels formatted as time. In "Format axis" pane next to the chart you can see how Excel treats axis parameters, namely that these are numbers and with decimal division into large and small ticks. For example, when entering axis minimum in this case, Excel will offer value 43581.74, where whole part is measurement date 26.4.2019 and decimal part 0.74 corresponds to time 17:45:36. For time, error is probably caused by entering value only to two decimal places, because "round" time 17:45:00 corresponds in decimal representation to number 0.73958333..., of course, Excel does not offer such a value, but nevertheless allows to enter it, well, but who is supposed to calculate it, especially when often works with timeline charts... And from graph you can clearly see how it works out, because then division into ticks does not correspond to division by hours, minutes and seconds, for example, it would be assumed to divide into major ticks after 15 minutes when their values would be 17:45:00; 18:00:00; 18:15:00 etc. and not as in this chart after 14 minutes and 24 seconds, and for dividing major ticks after 15 minutes minor ticks should be for example after one minute, so there should be 15 of them, and not as Excel in chart offers only 5 divided after about 3 minutes and 8.33... seconds, well "nice rounded" division is it, that...
So, if chart is selected, after clicking button of add-in, add-in window appears with values that add-in is able to change. Of course, these are not all options that axes have in Excel charts, but I tried to put the most important ones for normal use. Add-in window open above chart looks like this:
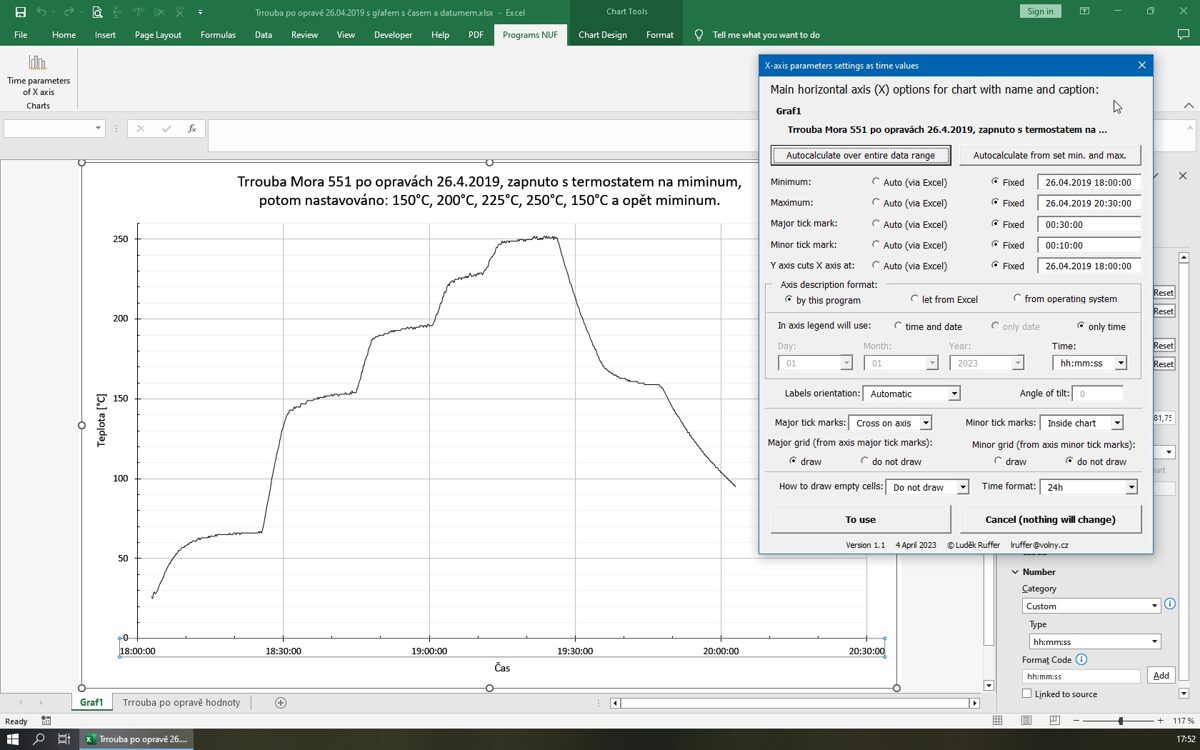
Here is shown state after clicking "Autocalculate over entire data range" button, when X time axis is already shown from 18:00:00 to 20:30:00 with a division into major ticks every 30 minutes and minor ticks every 10 minutes.
As you can see from add-in window, besides axis division, it can also set following values: format of axis descriptions and their orientation, drawing of minor and major ticks and grids, drawing of empty cells and selecting time format 12/24 hours. Except for changes in axis division, changes in other parameters are displayed in graph immediately after they are made, changes in axis division appear only after selecting another element (maybe after clicking on it with mouse), which is due to checks of entered data after their inputs, to ensure that only correct values are displayed in graph. So, it is possible to check changes made immediately in chart and continue making changes until chart is as expected, and then either click on "To use" button to pass changes to chart and close add-in, or click on "Cancel (nothing will change)" button to discard changes, which means chart will return to state before modifications and close add-in. After clicking "To use" button, changes are put into chart, but Excel file with chart still needs to be saved manually by Excel if changes are to be saved permanently.
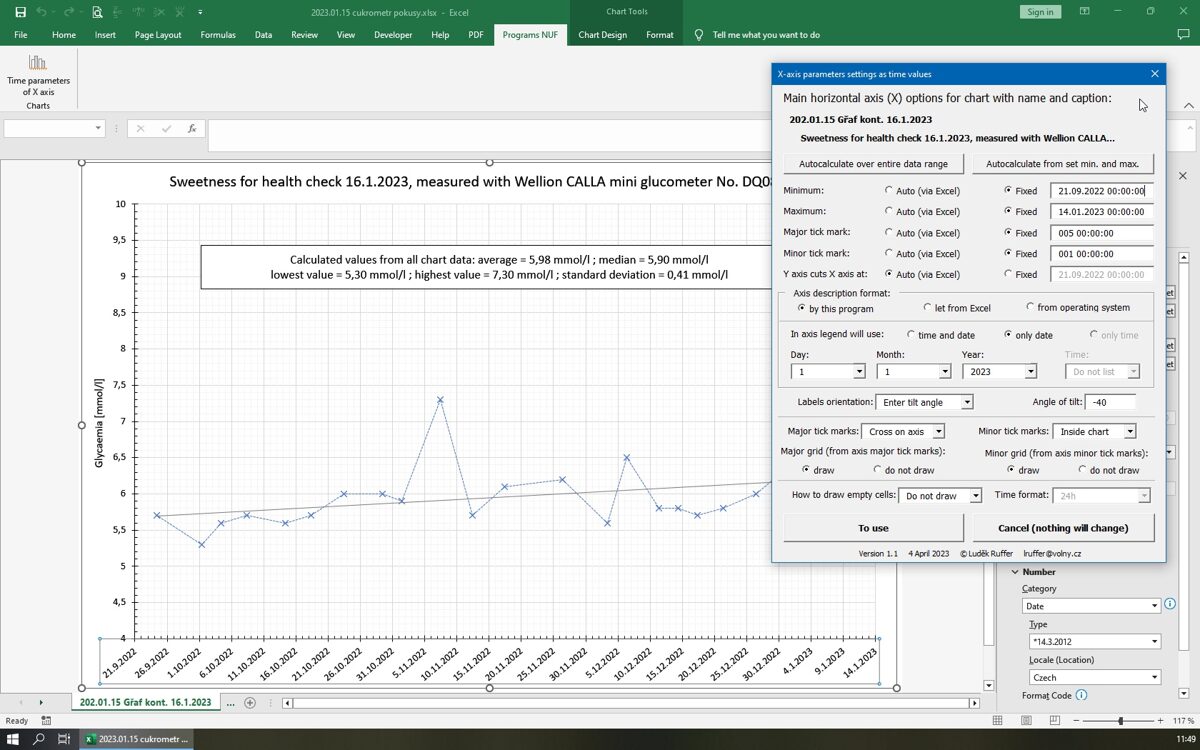
When time data includes a date, values for minimum, maximum and intersection with Y axis are always entered in form "dd.mm.yyyy hh:mm:ss", or entered only in form "hh:mm:ss" when they do not include date. It is not possible to enter dates in other formats, such as "yyyy.mm.dd" and others, add-in would either understand this as an error and not allow input, or it would interpret it incorrectly. Values for dividing into major and minor ticks are entered either in form "hh:mm:ss" for dividing based on hours, minutes and seconds, or, if chart has a range several days, in form "000 hh:mm:ss", where number of days for tick enters at 000 position. An example of a graph with division by days is shown in following picture:
Note: add-in allows (for now) to set time data ONLY ON MAIN HORIZONTAL AXIS. It does not allow to set time data on secondary horizontal axis, nor on vertical axes.
Add-in can be downloaded here: Time parameters of X axis.xlam